
100 Waterfowl Hunting Statistics
Duck and goose populations, the people who hunt them, and the habitat that connects it all—with a closer look at Colorado.
Compiled for Honker Nation · Research checked
How to read these numbers
This collection contains 100 distinct statistics from nine primary-source publications and program pages. Each item identifies its period and geography. Estimates retain the original source’s rounding. Sources link to tables, definitions, and confidence intervals.
Breeding populations, winter counts, retrieved harvest, and hunter participation measure different things. Totals may overlap. Historical Colorado records from 2020 and 2021 are explicitly dated. The 2022 national survey includes all migratory game birds and U.S. residents age 16 and older.
Source concentration is measured by publication. The largest source supplies 32 statistics. Several publications are produced by the same federal agency, reflecting its role in national monitoring.
Download the source inventory (CSV)100 statistics · Six charts
Duck and goose populations
Breeding surveys describe birds on their breeding grounds. Goose monitoring indices cover named populations and use differing methods.
Breeding ducks in the traditional survey area
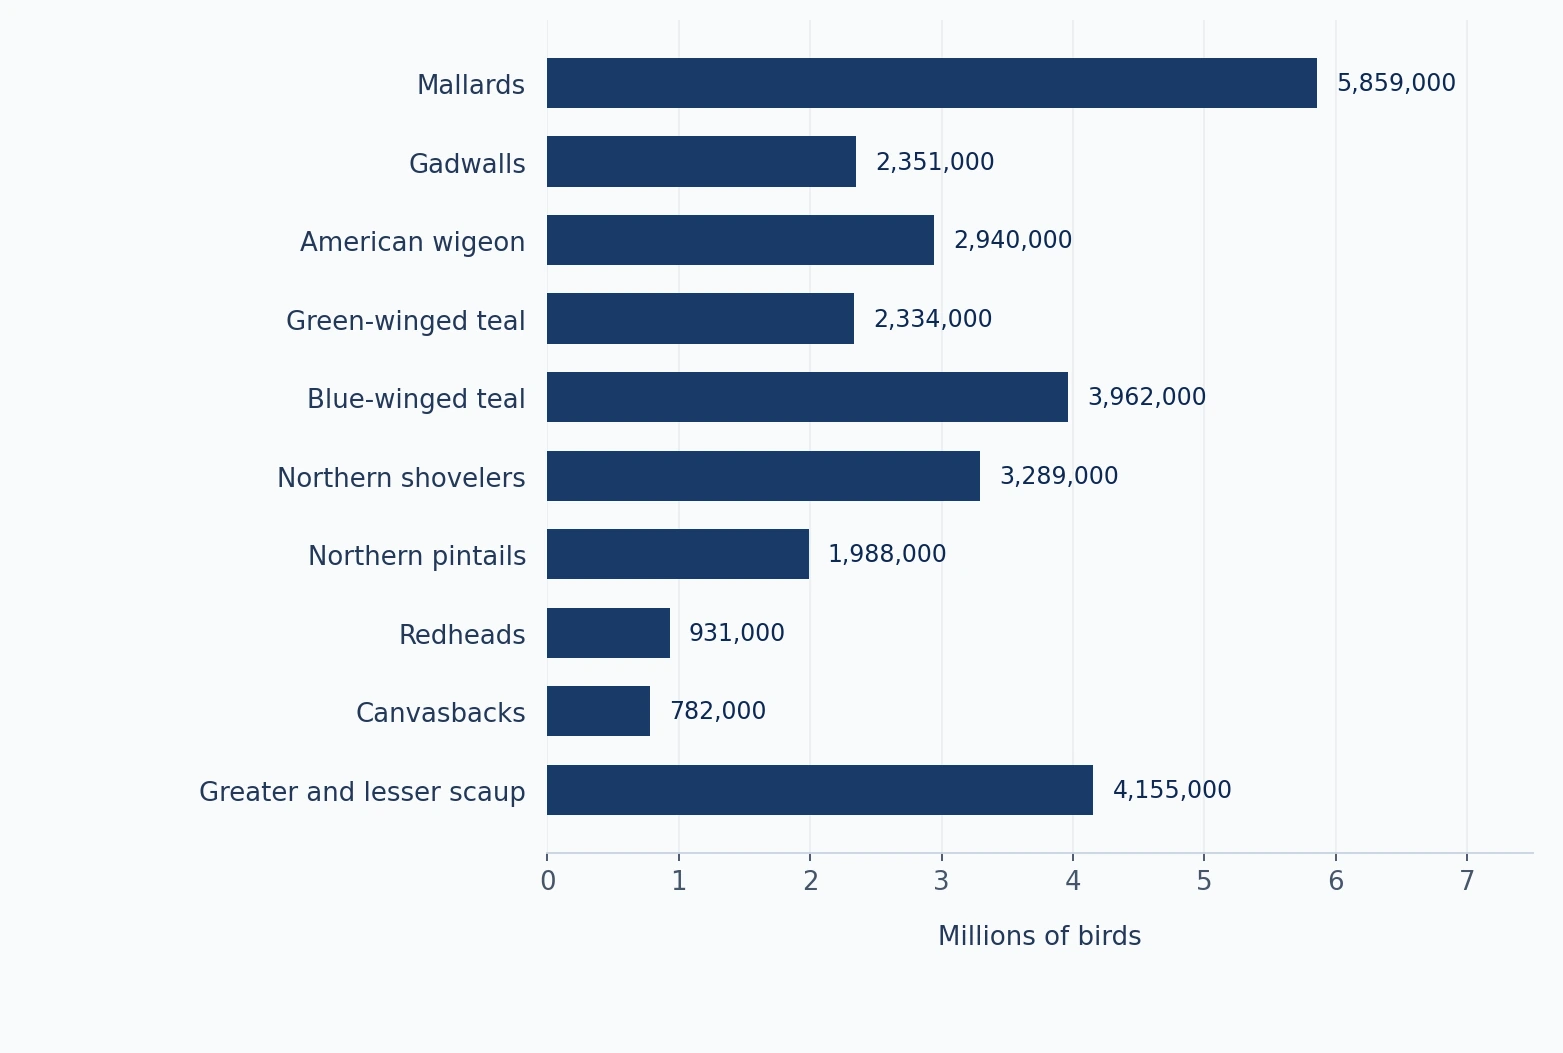
- 33,439,000 birdsTotal ducks
2026 · Traditional breeding survey area, western Canada and northwestern U.S.; selected duck species
Source and scope
Table values converted from thousands; survey total includes additional species. Table 2, printed p. 8
- 5,859,000 birdsMallards
2026 · Traditional breeding survey area, western Canada and northwestern U.S.; selected duck species
Source and scope
Table values converted from thousands; survey total includes additional species. Table 3, p. 9
- 2,351,000 birdsGadwalls
2026 · Traditional breeding survey area, western Canada and northwestern U.S.; selected duck species
Source and scope
Table values converted from thousands; survey total includes additional species. Table 4, p. 12
- 2,940,000 birdsAmerican wigeon
2026 · Traditional breeding survey area, western Canada and northwestern U.S.; selected duck species
Source and scope
Table values converted from thousands; survey total includes additional species. Table 5, p. 12
- 2,334,000 birdsGreen-winged teal
2026 · Traditional breeding survey area, western Canada and northwestern U.S.; selected duck species
Source and scope
Table values converted from thousands; survey total includes additional species. Table 6, p. 13
- 3,962,000 birdsBlue-winged teal
2026 · Traditional breeding survey area, western Canada and northwestern U.S.; selected duck species
Source and scope
Table values converted from thousands; survey total includes additional species. Table 8, p. 14
- 3,289,000 birdsNorthern shovelers
2026 · Traditional breeding survey area, western Canada and northwestern U.S.; selected duck species
Source and scope
Table values converted from thousands; survey total includes additional species. Table 7, p. 13
- 1,988,000 birdsNorthern pintails
2026 · Traditional breeding survey area, western Canada and northwestern U.S.; selected duck species
Source and scope
Table values converted from thousands; survey total includes additional species. Table 9, p. 14
- 931,000 birdsRedheads
2026 · Traditional breeding survey area, western Canada and northwestern U.S.; selected duck species
Source and scope
Table values converted from thousands; survey total includes additional species. Table 10, p. 15
- 782,000 birdsCanvasbacks
2026 · Traditional breeding survey area, western Canada and northwestern U.S.; selected duck species
Source and scope
Table values converted from thousands; survey total includes additional species. Table 11, p. 15
- 4,155,000 birdsGreater and lesser scaup
2026 · Traditional breeding survey area, western Canada and northwestern U.S.; selected duck species
Source and scope
Table values converted from thousands; survey total includes additional species. Table 12, p. 15
- 55,000 index birdsNorth Atlantic geese
2026 · Named Canada/cackling goose population; Table 14 monitoring area
Source and scope
Monitoring index; populations differ in survey methods and must not be summed. Table 14, printed p. 36
- 170,000 index birdsAtlantic geese
2026 · Named Canada/cackling goose population; Table 14 monitoring area
Source and scope
Monitoring index; populations differ in survey methods and must not be summed. Table 14, printed p. 36
- 1,009,000 index birdsAtlantic Flyway Resident geese
2026 · Named Canada/cackling goose population; Table 14 monitoring area
Source and scope
Monitoring index; populations differ in survey methods and must not be summed. Table 14, printed p. 36
- 55,000 index birdsSouthern Hudson Bay geese
2026 · Named Canada/cackling goose population; Table 14 monitoring area
Source and scope
Monitoring index; populations differ in survey methods and must not be summed. Table 14, printed p. 36
- 1,348,000 index birdsMississippi Flyway Giant geese
2026 · Named Canada/cackling goose population; Table 14 monitoring area
Source and scope
Monitoring index; populations differ in survey methods and must not be summed. Table 14, printed p. 36
- 873,000 index birdsWestern Prairie & Great Plains geese
2026 · Named Canada/cackling goose population; Table 14 monitoring area
Source and scope
Monitoring index; populations differ in survey methods and must not be summed. Table 14, printed p. 36
- 317,000 index birdsHi-Line geese
2026 · Named Canada/cackling goose population; Table 14 monitoring area
Source and scope
Monitoring index; populations differ in survey methods and must not be summed. Table 14, printed p. 36
- 351,000 index birdsWestern geese
2026 · Named Canada/cackling goose population; Table 14 monitoring area
Source and scope
Monitoring index; populations differ in survey methods and must not be summed. Table 14, printed p. 36
- 171,000 index birdsCackling/minima geese
2026 · Named Canada/cackling goose population; Table 14 monitoring area
Source and scope
Monitoring index; populations differ in survey methods and must not be summed. Table 14, printed p. 36
- 560,000 birdsAmerican black ducks
2025 · Eastern Waterfowl Survey core area, eastern Canada
Source and scope
Historical regional estimate; different geography from the traditional survey. Section 6.2.1
- 569,000 birdsMallards
2025 · Eastern Waterfowl Survey core area, eastern Canada
Source and scope
Historical regional estimate; different geography from the traditional survey. Section 6.2.2
- 234,000 birdsGreen-winged teal
2025 · Eastern Waterfowl Survey core area, eastern Canada
Source and scope
Historical regional estimate; different geography from the traditional survey. Section 6.2.4
- 17,700 birdsAmerican wigeon
2025 · Eastern Waterfowl Survey core area, eastern Canada
Source and scope
Historical regional estimate; different geography from the traditional survey. Section 6.2.6
- 573,000 birdsRing-necked ducks
2025 · Eastern Waterfowl Survey core area, eastern Canada
Source and scope
Historical regional estimate; different geography from the traditional survey. Section 6.2.10
Waterfowl hunters and participation
The 2025–26 HIP estimates and the broader 2022 recreation survey measure different audiences. Participation counts overlap across activities and geographies.
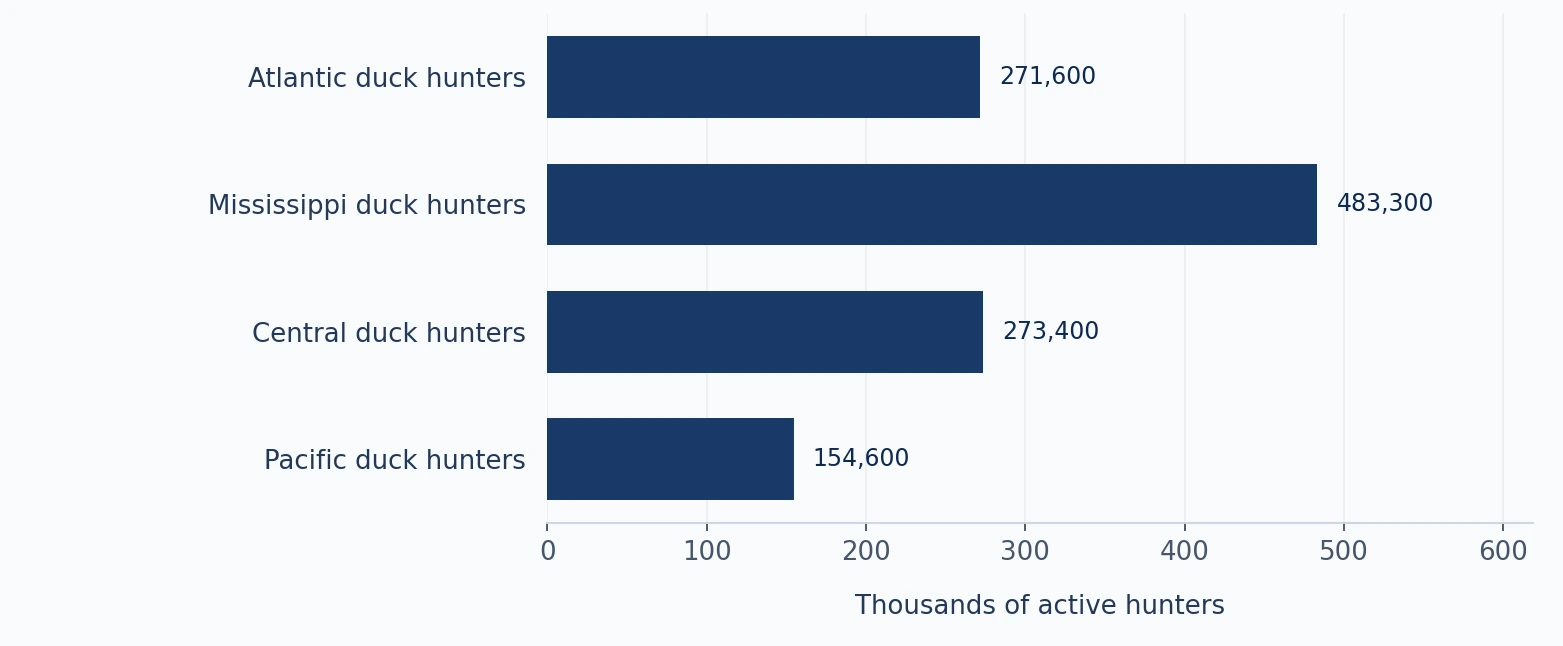
Active duck hunters by flyway
- 1,188,400 active huntersU.S. duck hunters
2025–26 · U.S.
Source and scope
Hunters may appear in more than one flyway; counts are not additive. Table 8, printed p. 15
Migratory Bird Hunting Activity and Harvest During the 2025–2026 Hunting Season
- 271,600 active huntersAtlantic duck hunters
2025–26 · Atlantic Flyway
Source and scope
Hunters may appear in more than one flyway; counts are not additive. Table 8, printed p. 15
Migratory Bird Hunting Activity and Harvest During the 2025–2026 Hunting Season
- 483,300 active huntersMississippi duck hunters
2025–26 · Mississippi Flyway
Source and scope
Hunters may appear in more than one flyway; counts are not additive. Table 8, printed p. 15
Migratory Bird Hunting Activity and Harvest During the 2025–2026 Hunting Season
- 273,400 active huntersCentral duck hunters
2025–26 · Central Flyway
Source and scope
Hunters may appear in more than one flyway; counts are not additive. Table 8, printed p. 15
Migratory Bird Hunting Activity and Harvest During the 2025–2026 Hunting Season
- 154,600 active huntersPacific duck hunters
2025–26 · Pacific Flyway
Source and scope
Hunters may appear in more than one flyway; counts are not additive. Table 8, printed p. 15
Migratory Bird Hunting Activity and Harvest During the 2025–2026 Hunting Season
- 8,161,900 hunter-daysU.S. duck hunting
2025–26 · U.S.
Source and scope
Estimated effort; one hunter on one day equals one hunter-day. Table 8, printed p. 15
Migratory Bird Hunting Activity and Harvest During the 2025–2026 Hunting Season
- 1,778,600 hunter-daysAtlantic duck hunting
2025–26 · Atlantic Flyway
Source and scope
Estimated effort; one hunter on one day equals one hunter-day. Table 8, printed p. 15
Migratory Bird Hunting Activity and Harvest During the 2025–2026 Hunting Season
- 3,664,700 hunter-daysMississippi duck hunting
2025–26 · Mississippi Flyway
Source and scope
Estimated effort; one hunter on one day equals one hunter-day. Table 8, printed p. 15
Migratory Bird Hunting Activity and Harvest During the 2025–2026 Hunting Season
- 1,566,100 hunter-daysCentral duck hunting
2025–26 · Central Flyway
Source and scope
Estimated effort; one hunter on one day equals one hunter-day. Table 8, printed p. 15
Migratory Bird Hunting Activity and Harvest During the 2025–2026 Hunting Season
- 1,124,000 hunter-daysPacific duck hunting
2025–26 · Pacific Flyway
Source and scope
Estimated effort; one hunter on one day equals one hunter-day. Table 8, printed p. 15
Migratory Bird Hunting Activity and Harvest During the 2025–2026 Hunting Season
- 629,600 active huntersU.S. goose hunters
2025–26 · U.S.
Source and scope
Table 17, printed p. 24
Migratory Bird Hunting Activity and Harvest During the 2025–2026 Hunting Season
- 3,594,100 hunter-daysU.S. goose hunting
2025–26 · U.S.
Source and scope
Table 17, printed p. 24
Migratory Bird Hunting Activity and Harvest During the 2025–2026 Hunting Season
- 14,374,589 peopleAll hunters
2022 · U.S. residents age 16 and older
Source and scope
Migratory birds include doves and other migratory game birds, as well as waterfowl. Percentages are rounded in the original table. Table 1
2022 National Survey of Fishing, Hunting, and Wildlife-Associated Recreation
- 240,752,065 hunter-daysAll hunting days
2022 · U.S. residents age 16 and older
Source and scope
Migratory birds include doves and other migratory game birds, as well as waterfowl. Percentages are rounded in the original table. Table 1
2022 National Survey of Fishing, Hunting, and Wildlife-Associated Recreation
- 165,002,494 tripsAll hunting trips
2022 · U.S. residents age 16 and older
Source and scope
Migratory birds include doves and other migratory game birds, as well as waterfowl. Percentages are rounded in the original table. Table 1
2022 National Survey of Fishing, Hunting, and Wildlife-Associated Recreation
- 2,812,364 peopleMigratory bird hunters
2022 · U.S. residents age 16 and older
Source and scope
Migratory birds include doves and other migratory game birds, as well as waterfowl. Percentages are rounded in the original table. Table 1
2022 National Survey of Fishing, Hunting, and Wildlife-Associated Recreation
- 22,861,271 hunter-daysMigratory bird days
2022 · U.S. residents age 16 and older
Source and scope
Migratory birds include doves and other migratory game birds, as well as waterfowl. Percentages are rounded in the original table. Table 1
2022 National Survey of Fishing, Hunting, and Wildlife-Associated Recreation
- 19,786,340 tripsMigratory bird trips
2022 · U.S. residents age 16 and older
Source and scope
Migratory birds include doves and other migratory game birds, as well as waterfowl. Percentages are rounded in the original table. Table 1
2022 National Survey of Fishing, Hunting, and Wildlife-Associated Recreation
- 20 %Hunters pursuing migratory birds
2022 · U.S. residents age 16 and older
Source and scope
Migratory birds include doves and other migratory game birds, as well as waterfowl. Percentages are rounded in the original table. Table 1
2022 National Survey of Fishing, Hunting, and Wildlife-Associated Recreation
- 9 %Hunting days for migratory birds
2022 · U.S. residents age 16 and older
Source and scope
Migratory birds include doves and other migratory game birds, as well as waterfowl. Percentages are rounded in the original table. Table 1
2022 National Survey of Fishing, Hunting, and Wildlife-Associated Recreation
Harvest totals and species
All figures below are preliminary 2025–26 estimates. Retrieved duck totals exclude sea ducks; the species estimates use the report’s species-composition methods.
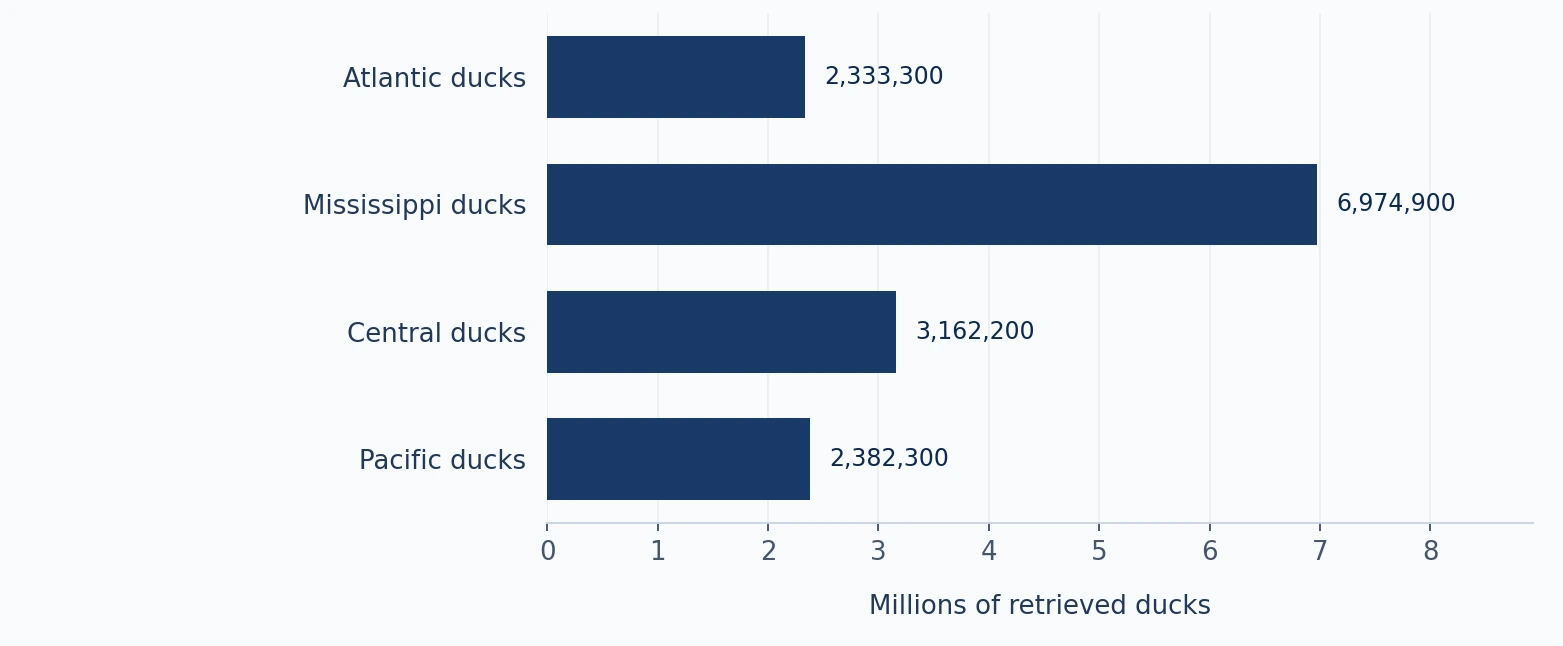
Duck harvest by flyway
- 3,486,900 birds harvestedMallard
2025–26 · U.S.
Source and scope
Preliminary species harvest estimate, rounded to nearest 100. Table 14, printed p. 21
Migratory Bird Hunting Activity and Harvest During the 2025–2026 Hunting Season
- 1,987,100 birds harvestedWood duck
2025–26 · U.S.
Source and scope
Preliminary species harvest estimate, rounded to nearest 100. Table 14, printed p. 21
Migratory Bird Hunting Activity and Harvest During the 2025–2026 Hunting Season
- 2,299,500 birds harvestedGreen-winged teal
2025–26 · U.S.
Source and scope
Preliminary species harvest estimate, rounded to nearest 100. Table 14, printed p. 21
Migratory Bird Hunting Activity and Harvest During the 2025–2026 Hunting Season
- 1,019,000 birds harvestedBlue-winged/cinnamon teal
2025–26 · U.S.
Source and scope
Preliminary species harvest estimate, rounded to nearest 100. Table 14, printed p. 21
Migratory Bird Hunting Activity and Harvest During the 2025–2026 Hunting Season
- 1,643,800 birds harvestedGadwall
2025–26 · U.S.
Source and scope
Preliminary species harvest estimate, rounded to nearest 100. Table 14, printed p. 21
Migratory Bird Hunting Activity and Harvest During the 2025–2026 Hunting Season
- 867,900 birds harvestedWigeon
2025–26 · U.S.
Source and scope
Preliminary species harvest estimate, rounded to nearest 100. Table 14, printed p. 21
Migratory Bird Hunting Activity and Harvest During the 2025–2026 Hunting Season
- 596,500 birds harvestedNorthern shoveler
2025–26 · U.S.
Source and scope
Preliminary species harvest estimate, rounded to nearest 100. Table 14, printed p. 21
Migratory Bird Hunting Activity and Harvest During the 2025–2026 Hunting Season
- 669,700 birds harvestedNorthern pintail
2025–26 · U.S.
Source and scope
Preliminary species harvest estimate, rounded to nearest 100. Table 14, printed p. 21
Migratory Bird Hunting Activity and Harvest During the 2025–2026 Hunting Season
- 158,400 birds harvestedRedhead
2025–26 · U.S.
Source and scope
Preliminary species harvest estimate, rounded to nearest 100. Table 14, printed p. 21
Migratory Bird Hunting Activity and Harvest During the 2025–2026 Hunting Season
- 114,800 birds harvestedCanvasback
2025–26 · U.S.
Source and scope
Preliminary species harvest estimate, rounded to nearest 100. Table 14, printed p. 21
Migratory Bird Hunting Activity and Harvest During the 2025–2026 Hunting Season
- 71,600 birds harvestedGreater scaup
2025–26 · U.S.
Source and scope
Preliminary species harvest estimate, rounded to nearest 100. Table 14, printed p. 21
Migratory Bird Hunting Activity and Harvest During the 2025–2026 Hunting Season
- 313,600 birds harvestedLesser scaup
2025–26 · U.S.
Source and scope
Preliminary species harvest estimate, rounded to nearest 100. Table 14, printed p. 21
Migratory Bird Hunting Activity and Harvest During the 2025–2026 Hunting Season
- 724,400 birds harvestedRing-necked duck
2025–26 · U.S.
Source and scope
Preliminary species harvest estimate, rounded to nearest 100. Table 14, printed p. 21
Migratory Bird Hunting Activity and Harvest During the 2025–2026 Hunting Season
- 2,253,400 birds harvestedCanada goose
2025–26 · U.S.
Source and scope
Preliminary species harvest estimate, rounded to nearest 100. Table 14, printed p. 21
Migratory Bird Hunting Activity and Harvest During the 2025–2026 Hunting Season
- 2,333,300 birds retrievedAtlantic ducks
2025–26 · Atlantic Flyway
Source and scope
Excludes sea ducks. Preliminary estimate, rounded to nearest 100. Table 8, printed p. 15
Migratory Bird Hunting Activity and Harvest During the 2025–2026 Hunting Season
- 6,974,900 birds retrievedMississippi ducks
2025–26 · Mississippi Flyway
Source and scope
Excludes sea ducks. Preliminary estimate, rounded to nearest 100. Table 8, printed p. 15
Migratory Bird Hunting Activity and Harvest During the 2025–2026 Hunting Season
- 3,162,200 birds retrievedCentral ducks
2025–26 · Central Flyway
Source and scope
Excludes sea ducks. Preliminary estimate, rounded to nearest 100. Table 8, printed p. 15
Migratory Bird Hunting Activity and Harvest During the 2025–2026 Hunting Season
- 2,382,300 birds retrievedPacific ducks
2025–26 · Pacific Flyway
Source and scope
Excludes sea ducks. Preliminary estimate, rounded to nearest 100. Table 8, printed p. 15
Migratory Bird Hunting Activity and Harvest During the 2025–2026 Hunting Season
- 14,910,800 birds retrievedU.S. ducks
2025–26 · U.S. including Alaska
Source and scope
Excludes sea ducks; differs from the Table 14 species-composition total. Table 8, printed p. 15
Migratory Bird Hunting Activity and Harvest During the 2025–2026 Hunting Season
- 3,653,900 birds retrievedU.S. geese
2025–26 · U.S. including Alaska
Source and scope
Goose total excludes brant; differs from the Table 14 geese-and-brant total. Table 17, printed p. 24
Migratory Bird Hunting Activity and Harvest During the 2025–2026 Hunting Season
Colorado and the Central Flyway
Historical Colorado context. Winter counts describe birds observed during a survey, rather than annual harvest or the number of birds available today.
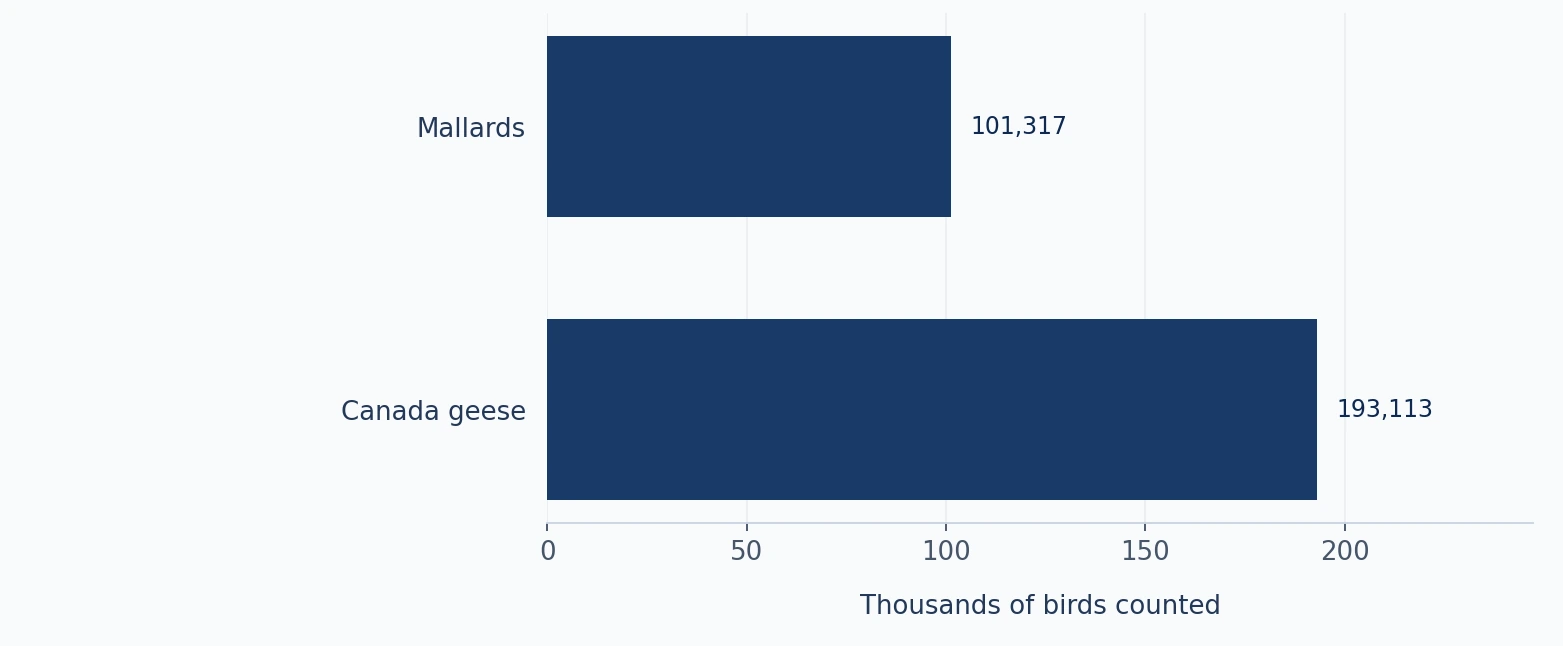
Northeast Colorado winter count
- 148,183 birds countedMallards
2020 mid-winter · Colorado portion of Central Flyway
Source and scope
Historical count index; includes only surveyed areas. Page 1, Central Flyway Colorado, 2020 row
Central Flyway Colorado Mid-Winter Waterfowl Count, 2004–2020
- 175,910 birds countedAll ducks
2020 mid-winter · Colorado portion of Central Flyway
Source and scope
Historical count index; includes only surveyed areas. Page 1, Central Flyway Colorado, 2020 row
Central Flyway Colorado Mid-Winter Waterfowl Count, 2004–2020
- 214,643 birds countedCanada geese
2020 mid-winter · Colorado portion of Central Flyway
Source and scope
Historical count index; includes only surveyed areas. Page 1, Central Flyway Colorado, 2020 row
Central Flyway Colorado Mid-Winter Waterfowl Count, 2004–2020
- 200,873 birds countedSnow/Ross geese
2020 mid-winter · Colorado portion of Central Flyway
Source and scope
Historical count index; includes only surveyed areas. Page 1, Central Flyway Colorado, 2020 row
Central Flyway Colorado Mid-Winter Waterfowl Count, 2004–2020
- 415,519 birds countedAll geese
2020 mid-winter · Colorado portion of Central Flyway
Source and scope
Historical count index; includes only surveyed areas. Page 1, Central Flyway Colorado, 2020 row
Central Flyway Colorado Mid-Winter Waterfowl Count, 2004–2020
- 591,446 birds countedAll waterfowl
2020 mid-winter · Colorado portion of Central Flyway
Source and scope
Historical count index; includes only surveyed areas. Page 1, Central Flyway Colorado, 2020 row
Central Flyway Colorado Mid-Winter Waterfowl Count, 2004–2020
- 101,317 birds countedMallards
2020 mid-winter · Northeast Colorado region
Source and scope
Subset of the Colorado Central Flyway count. Page 1, Northeast Region, 2020 row
Central Flyway Colorado Mid-Winter Waterfowl Count, 2004–2020
- 118,005 birds countedAll ducks
2020 mid-winter · Northeast Colorado region
Source and scope
Subset of the Colorado Central Flyway count. Page 1, Northeast Region, 2020 row
Central Flyway Colorado Mid-Winter Waterfowl Count, 2004–2020
- 193,113 birds countedCanada geese
2020 mid-winter · Northeast Colorado region
Source and scope
Subset of the Colorado Central Flyway count. Page 1, Northeast Region, 2020 row
Central Flyway Colorado Mid-Winter Waterfowl Count, 2004–2020
- 400,144 birds countedAll waterfowl
2020 mid-winter · Northeast Colorado region
Source and scope
Subset of the Colorado Central Flyway count. Page 1, Northeast Region, 2020 row
Central Flyway Colorado Mid-Winter Waterfowl Count, 2004–2020
- 2,833 huntersLight goose hunters
2021 conservation action · Colorado statewide
Source and scope
Special light-goose conservation action; separate from regular fall/winter seasons. Regional rounded estimates may differ from the statewide total. PDF p. 2, Harvest Summary by Area
- 14,220 hunter-daysLight goose effort
2021 conservation action · Colorado statewide
Source and scope
Special light-goose conservation action; separate from regular fall/winter seasons. Regional rounded estimates may differ from the statewide total. PDF p. 2, Harvest Summary by Area
- 15,164 birdsLight goose harvest
2021 conservation action · Colorado statewide
Source and scope
Special light-goose conservation action; separate from regular fall/winter seasons. Regional rounded estimates may differ from the statewide total. PDF p. 2, Harvest Summary by Area
- 10,275 birdsNorth of I-70 harvest
2021 conservation action · Colorado north of I-70
Source and scope
Special light-goose conservation action; separate from regular fall/winter seasons. Regional rounded estimates may differ from the statewide total. PDF p. 2, Harvest Summary by Area
- 4,888 birdsSouth of I-70 harvest
2021 conservation action · Colorado south of I-70
Source and scope
Special light-goose conservation action; separate from regular fall/winter seasons. Regional rounded estimates may differ from the statewide total. PDF p. 2, Harvest Summary by Area
Wetlands and habitat
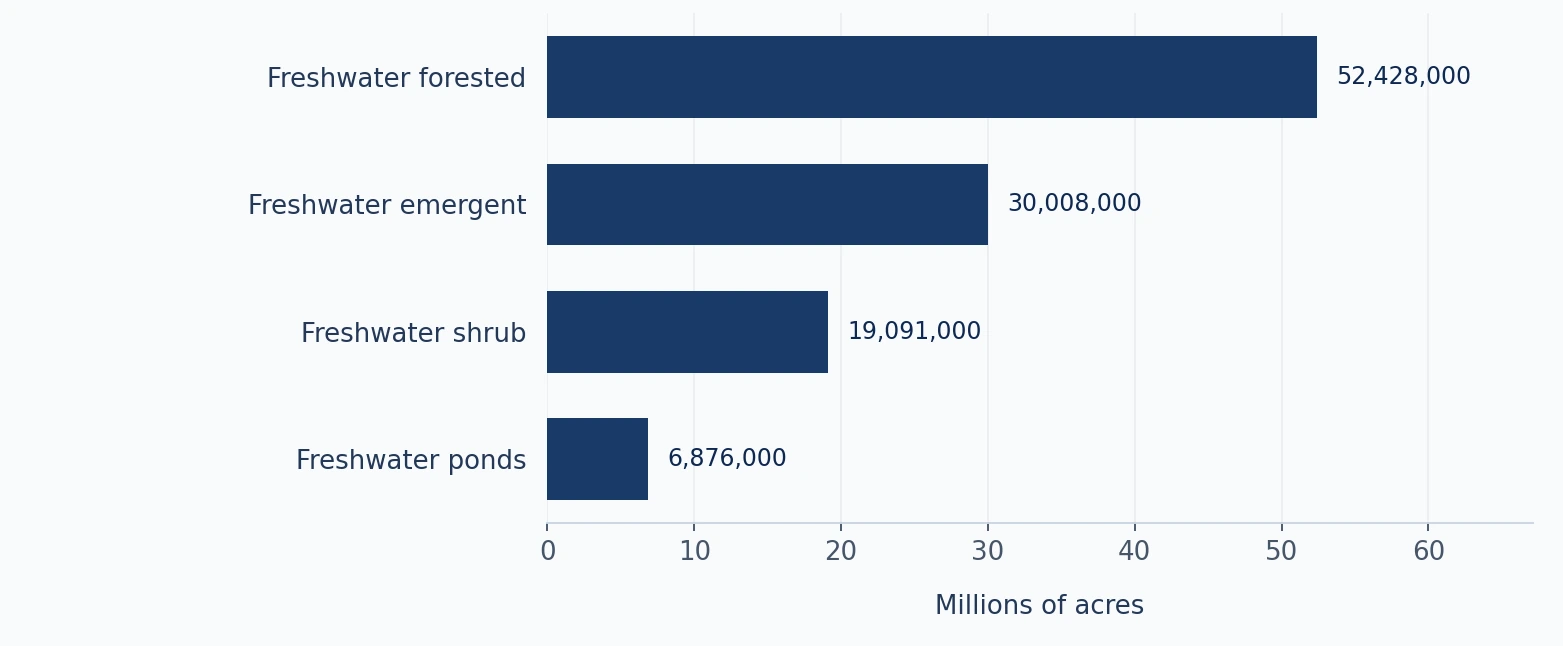
These estimates cover the contiguous United States. Habitat area is measured in acres; changes span 2009–2019.
Freshwater habitat types
- 116,437,000 acresAll wetlands
2019 · Conterminous U.S.
Source and scope
Published table values converted from thousands of acres. Loss/gain categories overlap the net total. Table 2
Status and Trends of Wetlands in the Conterminous United States, 2009 to 2019
- 110,376,000 acresFreshwater wetlands
2019 · Conterminous U.S.
Source and scope
Published table values converted from thousands of acres. Loss/gain categories overlap the net total. Table 2
Status and Trends of Wetlands in the Conterminous United States, 2009 to 2019
- 6,061,000 acresSaltwater wetlands
2019 · Conterminous U.S.
Source and scope
Published table values converted from thousands of acres. Loss/gain categories overlap the net total. Table 2
Status and Trends of Wetlands in the Conterminous United States, 2009 to 2019
- 52,428,000 acresFreshwater forested
2019 · Conterminous U.S.
Source and scope
Published table values converted from thousands of acres. Loss/gain categories overlap the net total. Table 2
Status and Trends of Wetlands in the Conterminous United States, 2009 to 2019
- 30,008,000 acresFreshwater emergent
2019 · Conterminous U.S.
Source and scope
Published table values converted from thousands of acres. Loss/gain categories overlap the net total. Table 2
Status and Trends of Wetlands in the Conterminous United States, 2009 to 2019
- 19,091,000 acresFreshwater shrub
2019 · Conterminous U.S.
Source and scope
Published table values converted from thousands of acres. Loss/gain categories overlap the net total. Table 2
Status and Trends of Wetlands in the Conterminous United States, 2009 to 2019
- 6,876,000 acresFreshwater ponds
2019 · Conterminous U.S.
Source and scope
Published table values converted from thousands of acres. Loss/gain categories overlap the net total. Table 2
Status and Trends of Wetlands in the Conterminous United States, 2009 to 2019
- 221,000 acres lostNet wetland loss
2009–2019 · Conterminous U.S.
Source and scope
Published table values converted from thousands of acres. Loss/gain categories overlap the net total. Table 2
Status and Trends of Wetlands in the Conterminous United States, 2009 to 2019
- 670,000 acres lostVegetated wetland loss
2009–2019 · Conterminous U.S.
Source and scope
Published table values converted from thousands of acres. Loss/gain categories overlap the net total. Table 2
Status and Trends of Wetlands in the Conterminous United States, 2009 to 2019
- 488,000 acres gainedNon-vegetated wetland gain
2009–2019 · Conterminous U.S.
Source and scope
Published table values converted from thousands of acres. Loss/gain categories overlap the net total. Table 2
Status and Trends of Wetlands in the Conterminous United States, 2009 to 2019
Conservation funding and economics
Organization finances and cumulative habitat funding are distinct measures. Revenue figures below describe Ducks Unlimited’s fiscal year 2026.
DU reported funding measures
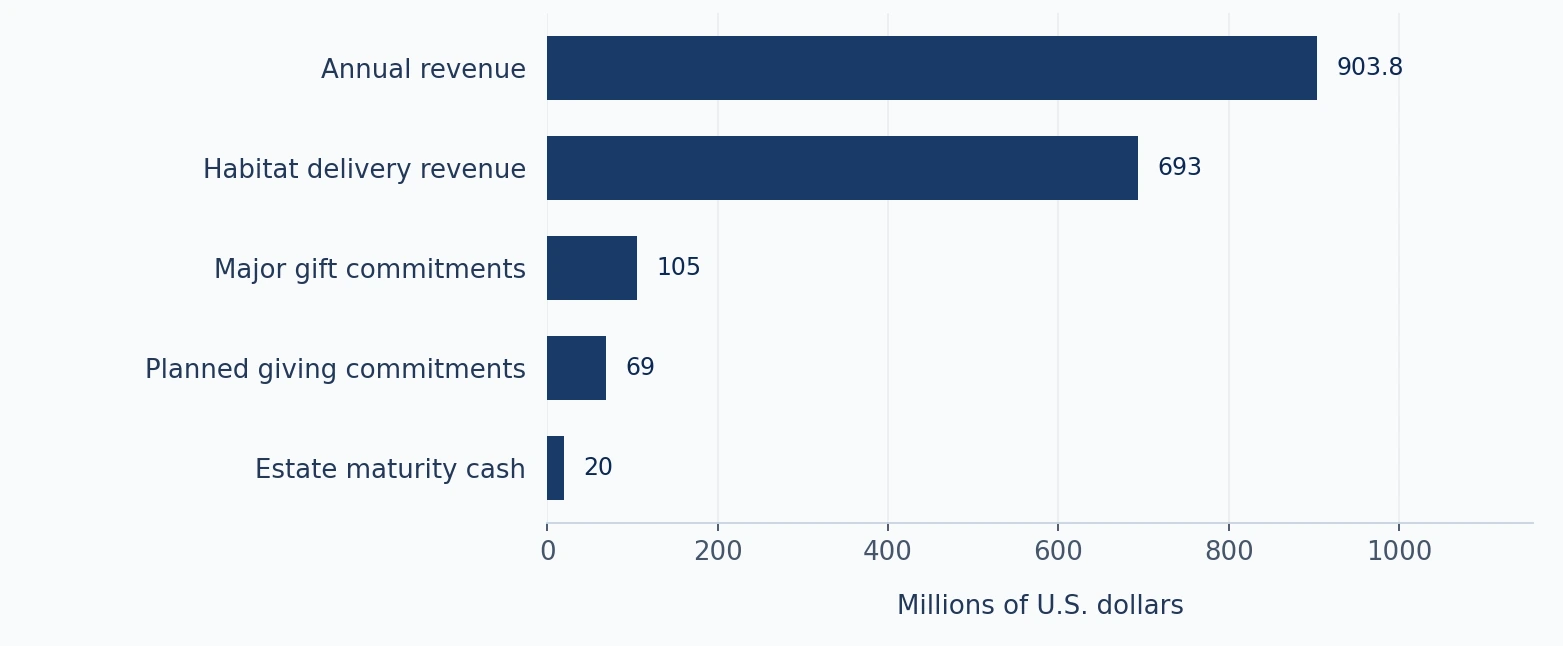
- 903.8 million USDAnnual revenue
FY2026 · Ducks Unlimited organization / continental campaign
Source and scope
Categories overlap and represent cash, revenue, or commitments as labeled; do not sum. The Money; introductory campaign summary
- 93 %Mission expenditure share
FY2026 · Ducks Unlimited organization / continental campaign
Source and scope
Categories overlap and represent cash, revenue, or commitments as labeled; do not sum. The Money; introductory campaign summary
- 693 million USDHabitat delivery revenue
FY2026 · Ducks Unlimited organization / continental campaign
Source and scope
Categories overlap and represent cash, revenue, or commitments as labeled; do not sum. The Money; introductory campaign summary
- 105 million USD, more thanMajor gift commitments
FY2026 · Ducks Unlimited organization / continental campaign
Source and scope
Categories overlap and represent cash, revenue, or commitments as labeled; do not sum. The Money; introductory campaign summary
- 69 million USDPlanned giving commitments
FY2026 · Ducks Unlimited organization / continental campaign
Source and scope
Categories overlap and represent cash, revenue, or commitments as labeled; do not sum. The Money; introductory campaign summary
- 20 million USDEstate maturity cash
FY2026 · Ducks Unlimited organization / continental campaign
Source and scope
Categories overlap and represent cash, revenue, or commitments as labeled; do not sum. The Money; introductory campaign summary
- 4.06 billion USDContinental campaign raised
2019–June 2026 · Ducks Unlimited organization / continental campaign
Source and scope
Categories overlap and represent cash, revenue, or commitments as labeled; do not sum. The Money; introductory campaign summary
- 98 %Stamp price for habitat
Program cumulative since 1934; checked November 18, 2026 · U.S. Federal Duck Stamp program
Source and scope
98% refers to the purchase price directed to acquisition and easements. What We Do
- 1.3 billion USD, more thanCumulative stamp revenue
Program cumulative since 1934; checked November 18, 2026 · U.S. Federal Duck Stamp program
Source and scope
98% refers to the purchase price directed to acquisition and easements. What We Do
- 6 million acres, more thanHabitat conserved
Program cumulative since 1934; checked November 18, 2026 · U.S. Federal Duck Stamp program
Source and scope
98% refers to the purchase price directed to acquisition and easements. What We Do
Methods and primary sources
We transcribed point estimates from the linked original tables and program summaries. Values reported in thousands were converted to whole birds or acres. Charts reuse the numbered statistics; they add no extra observations. Source-specific notes explain geographic limits, overlapping categories, and differences between survey methods.
The latest sources available during this research were used where accessible. Colorado’s publicly linked mid-winter count series ends in 2020, and its linked light-goose report describes 2021. These older observations provide context for Northern Colorado and are shown with their reporting dates.
USFWS species harvest totals can differ from retrieved-harvest totals because the tables define categories differently. Goose monitoring indices represent named populations and differing methods. Readers can follow each source for uncertainty estimates and sampling details.
Hunting dates, licenses, and bag limits should be checked with Colorado Parks and Wildlife for the relevant season.
- Waterfowl Population Status, 2026
U.S. Fish & Wildlife Service · 20 statistics
- Population status of migratory game birds in Canada, 2025
Environment and Climate Change Canada · 5 statistics
- Migratory Bird Hunting Activity and Harvest During the 2025–2026 Hunting Season
U.S. Fish & Wildlife Service · 32 statistics
- 2022 National Survey of Fishing, Hunting, and Wildlife-Associated Recreation
U.S. Fish & Wildlife Service / Association of Fish & Wildlife Agencies · 8 statistics
- Central Flyway Colorado Mid-Winter Waterfowl Count, 2004–2020
Colorado Parks and Wildlife · 10 statistics
- 2021 Light Goose Conservation Action Harvest Report
Colorado Parks and Wildlife · 5 statistics
- Status and Trends of Wetlands in the Conterminous United States, 2009 to 2019
U.S. Fish & Wildlife Service · 10 statistics
- Ducks Unlimited’s 2026 Annual Report
Ducks Unlimited · 7 statistics
- Federal Duck Stamp program
U.S. Fish & Wildlife Service · 3 statistics
Explore how Honker Nation works or see photos from the field.